往常咱们测试程序,尤其是单个脚本及函数的性能,更多的是使用time.time() 来计算。 其实完全可以不要这样。 python语言有个Cprofile 库,是来分析所有过程的时间消耗的。
import time
t = 0
def a():
    time.sleep(1)

def b():
    time.sleep(2)

def c():
    time.sleep(3)

for i in range(100):
    t += i

a()
b()
c()
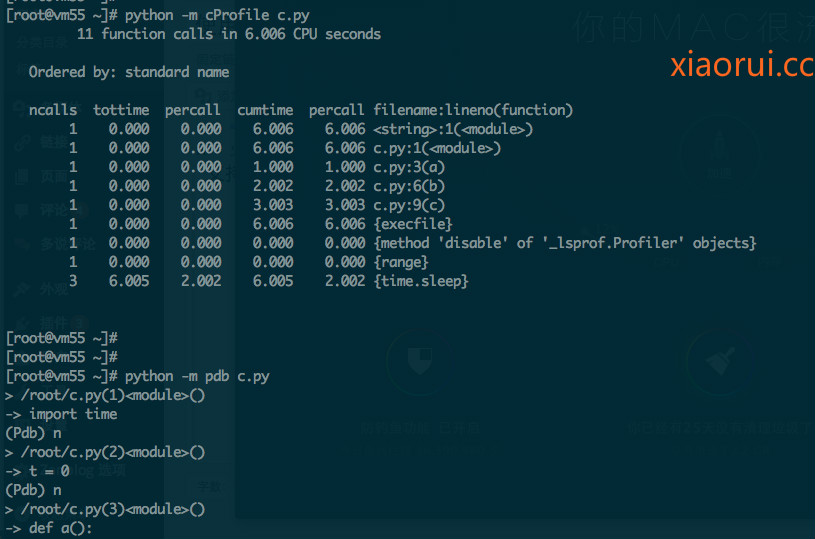
下面可以很清晰的看到,各个步骤的及函数的消耗时间。
ncalls tottime percall cumtime percall filename:lineno(function)
1 0.000 0.000 6.006 6.006 <string>:1(<module>)
1 0.000 0.000 6.006 6.006 c.py:1(<module>)
1 0.000 0.000 1.000 1.000 c.py:3(a)
1 0.000 0.000 2.002 2.002 c.py:6(b)
1 0.000 0.000 3.003 3.003 c.py:9(c)
1 0.000 0.000 6.006 6.006 {execfile}
1 0.000 0.000 0.000 0.000 {method ‘disable’ of ‘_lsprof.Profiler’ objects}
1 0.000 0.000 0.000 0.000 {range}
3 6.005 2.002 6.005 2.002 {time.sleep}
还有一个是pdb,这个是用来一步步的调试程序用的,可以理解为IDE上面的逐步断点 。
python pdb调试
python -m pdb myscript.py #注意这会重启myscript.py,这样启动的话,代码每一行都是一个节点
也可以在程序中这么设置断点:
import pdb; pdb.set_trace()

支持的命令:
    p 打印变量
    n next
    step 细点运行
    c continue
    l list
    a args 打印当前函数的参数
    condition bpnumber [condition]
    clear/disable/enable 清除/禁用/使能断点
    q quit
>断点设置
   (Pdb)b  10 #断点设置在本py的第10行
   或(Pdb)b  ots.py:20 #断点设置到 ots.py第20行
   删除断点(Pdb)b #查看断点编号
            (Pdb)cl 2 #删除第2个断点
>运行
    (Pdb)n #单步运行
    (Pdb)s #细点运行 也就是会下到,方法
    (Pdb)c #跳到下个断点
>查看
    (Pdb)p param #查看当前 变量值
    (Pdb)l #查看运行到某处代码
    (Pdb)a #查看全部栈内变量